Strategy Builder
Strategy Builder defines multiple allocation rules and switches between them when their signals change state. Use it when the question is about rule-driven portfolio changes over time.
Open Strategy Builder →Use this when
Use Strategy Builder when the portfolio should hold different things in different market states. For example, equities while a trend signal is on, bonds otherwise. You define ordered rules and the engine switches between them.
Good for
- Rule-based regime switching with one or two signals.
- Ranked rotations across a small universe (top-N momentum, dual momentum, etc.).
- Comparing how different signals would have changed when the strategy traded.
Reach for a different tool when
- Strategies whose composition does not change. Use Portfolio Backtest.
- Testing whether an indicator predicts anything in the first place. Use Signal Analyzer.
Strategy Builder walkthrough
Start with the market question and the signal that changes the allocation.
Build rules in priority order, with a fallback rule at the bottom.
Run the strategy, inspect state transitions, then validate the saved strategy in Portfolio Backtest.
First run
Define the scenario
Set date range, benchmark, trading frequency, and initial capital.
Build rules
Add the risk-on rule first and a fallback rule last.
Review advanced settings
Use cooldown, lag, and ranked rules only when the question requires them.
Run and validate
Inspect state changes before reusing the strategy in Portfolio Backtest.
Configuration Guide
Strategy Builder settings define when the portfolio is allowed to change state and what it holds in each state. The important question is whether each rule expresses a defensible decision, not whether the form is filled out.
Set the dollar scale and price mode
The scenario row anchors what every dollar figure in the result represents.
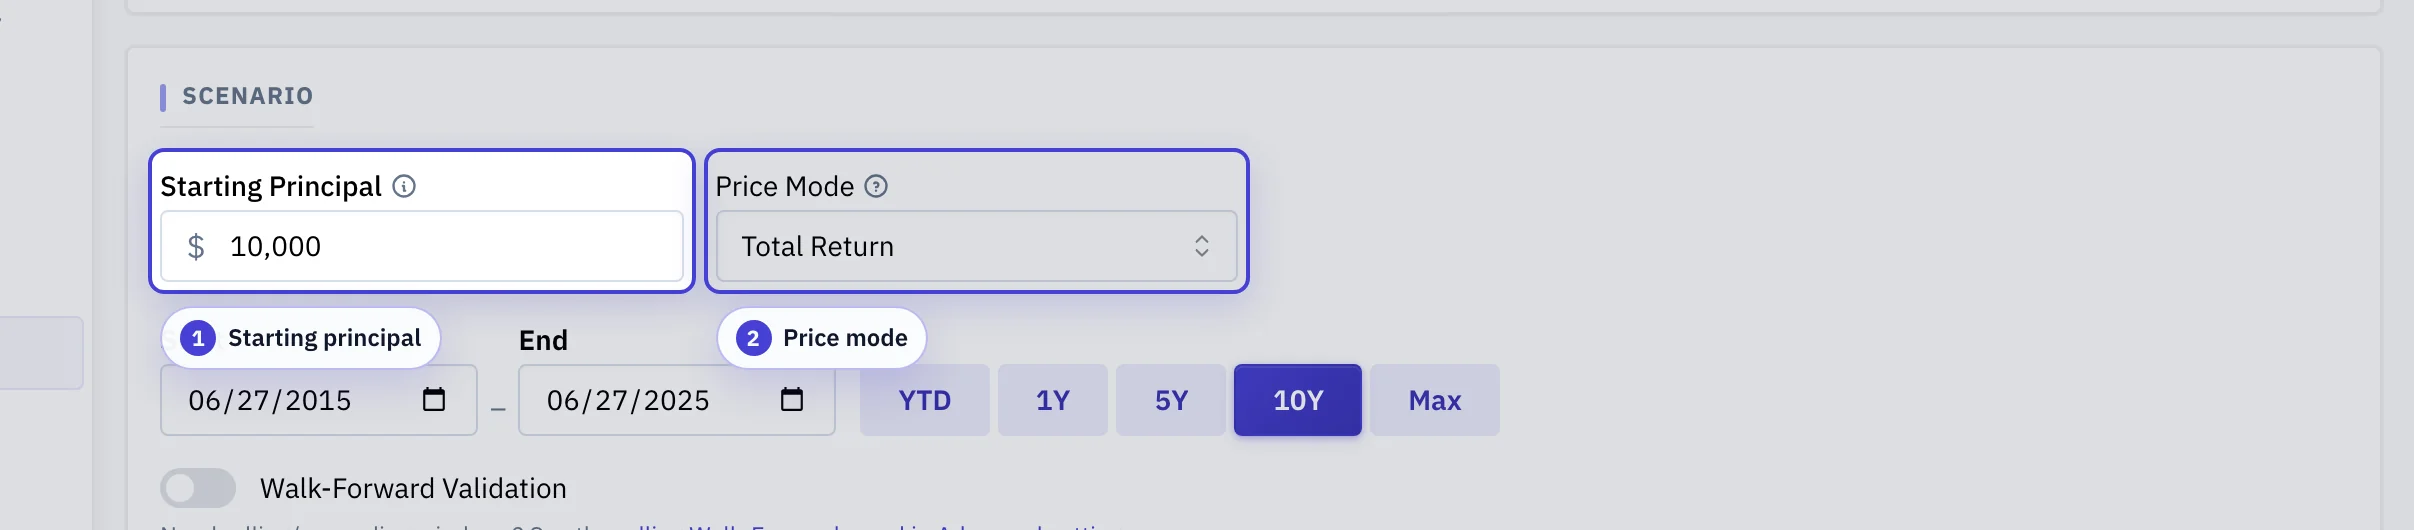
Starting principal: The dollar amount the strategy starts with. Drives the scale of every value, drawdown, and cashflow chart.
Price mode: Total return (adjusted prices) includes dividends and distributions; Raw keeps them separate. Most rule-driven strategies want Total return.
Choose the backtest window
The window decides which market regimes your rules get tested against.
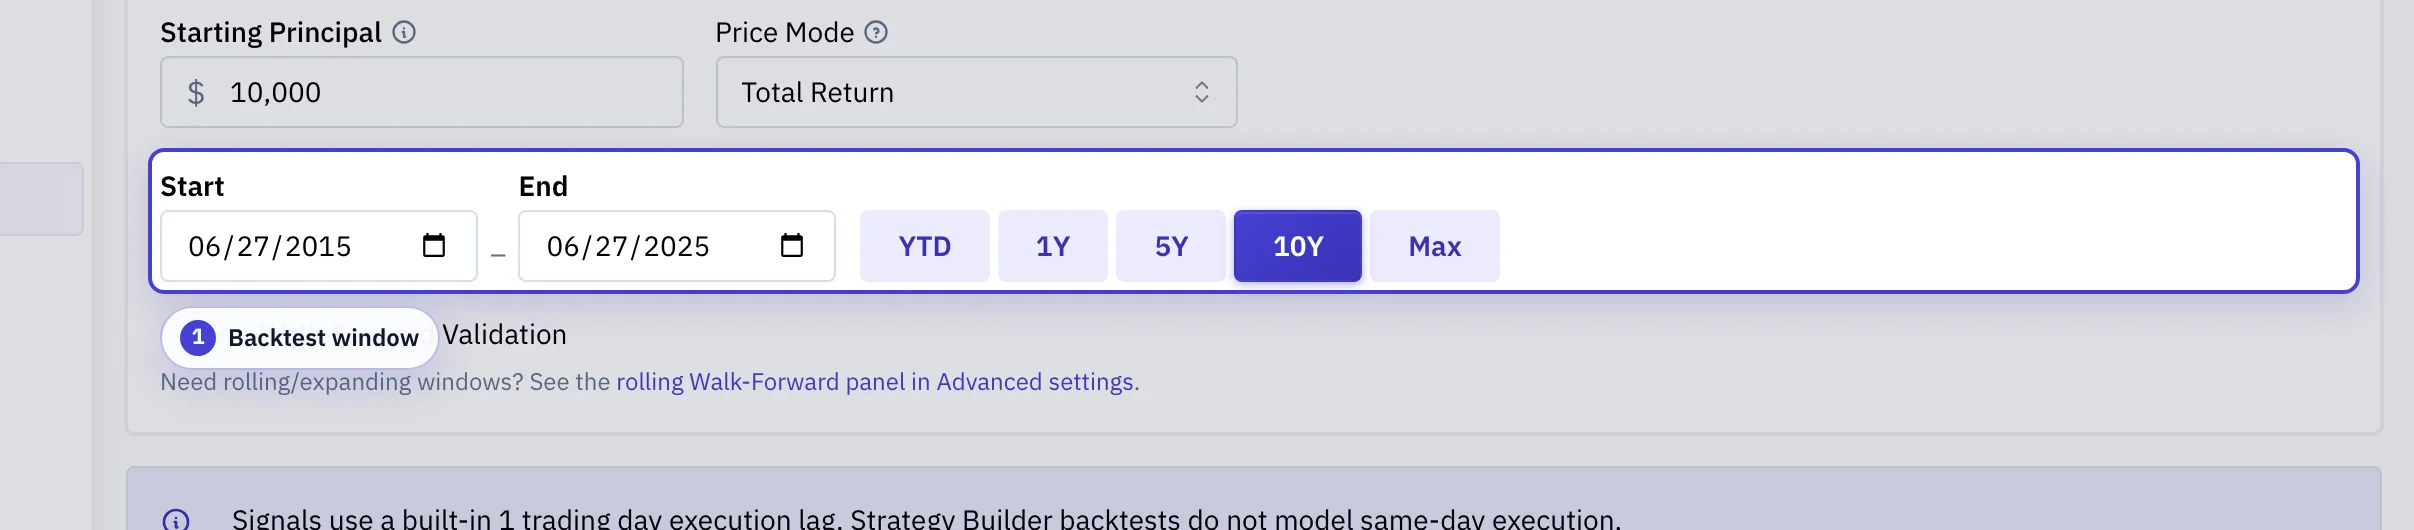
Backtest window: Span at least one major drawdown when you can. A calm window flatters rule-based strategies.
Order the rules from most specific to fallback
Rules evaluate top-to-bottom, and the first match wins.
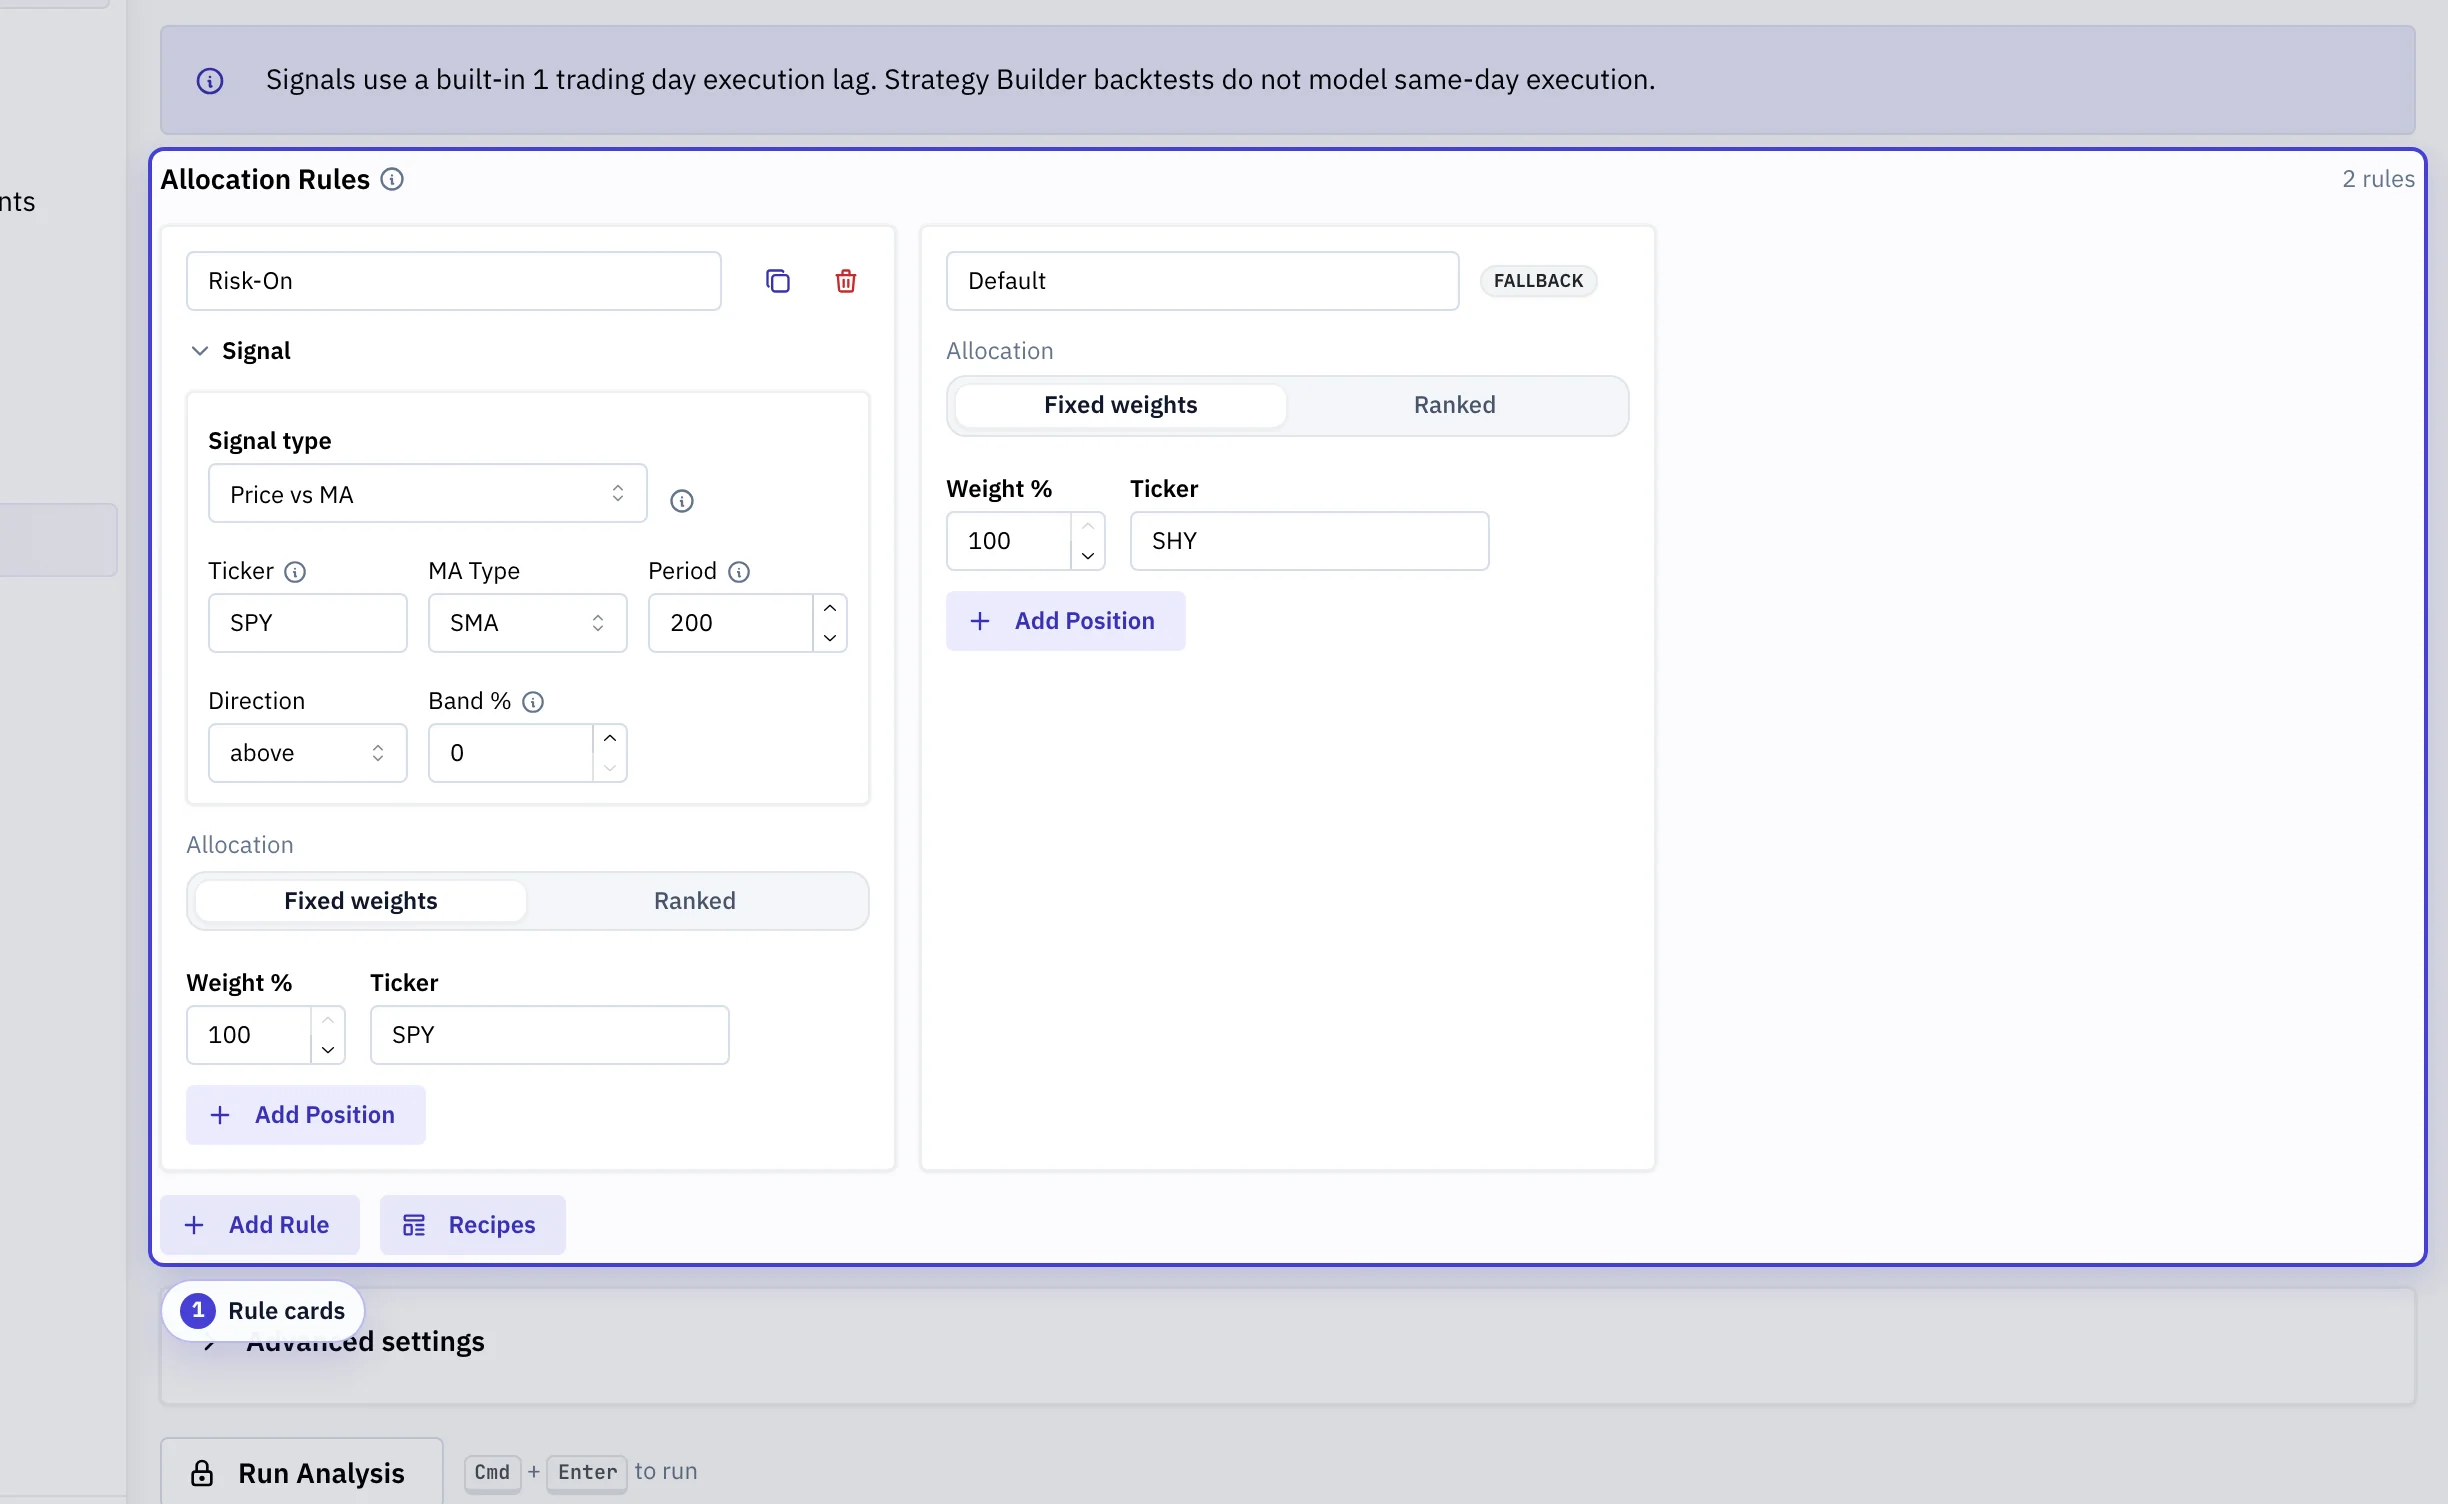
Rule cards: Ordered conditions with per-rule allocations. Put narrower conditions higher; the last rule has no condition and catches every state none of the earlier rules described.
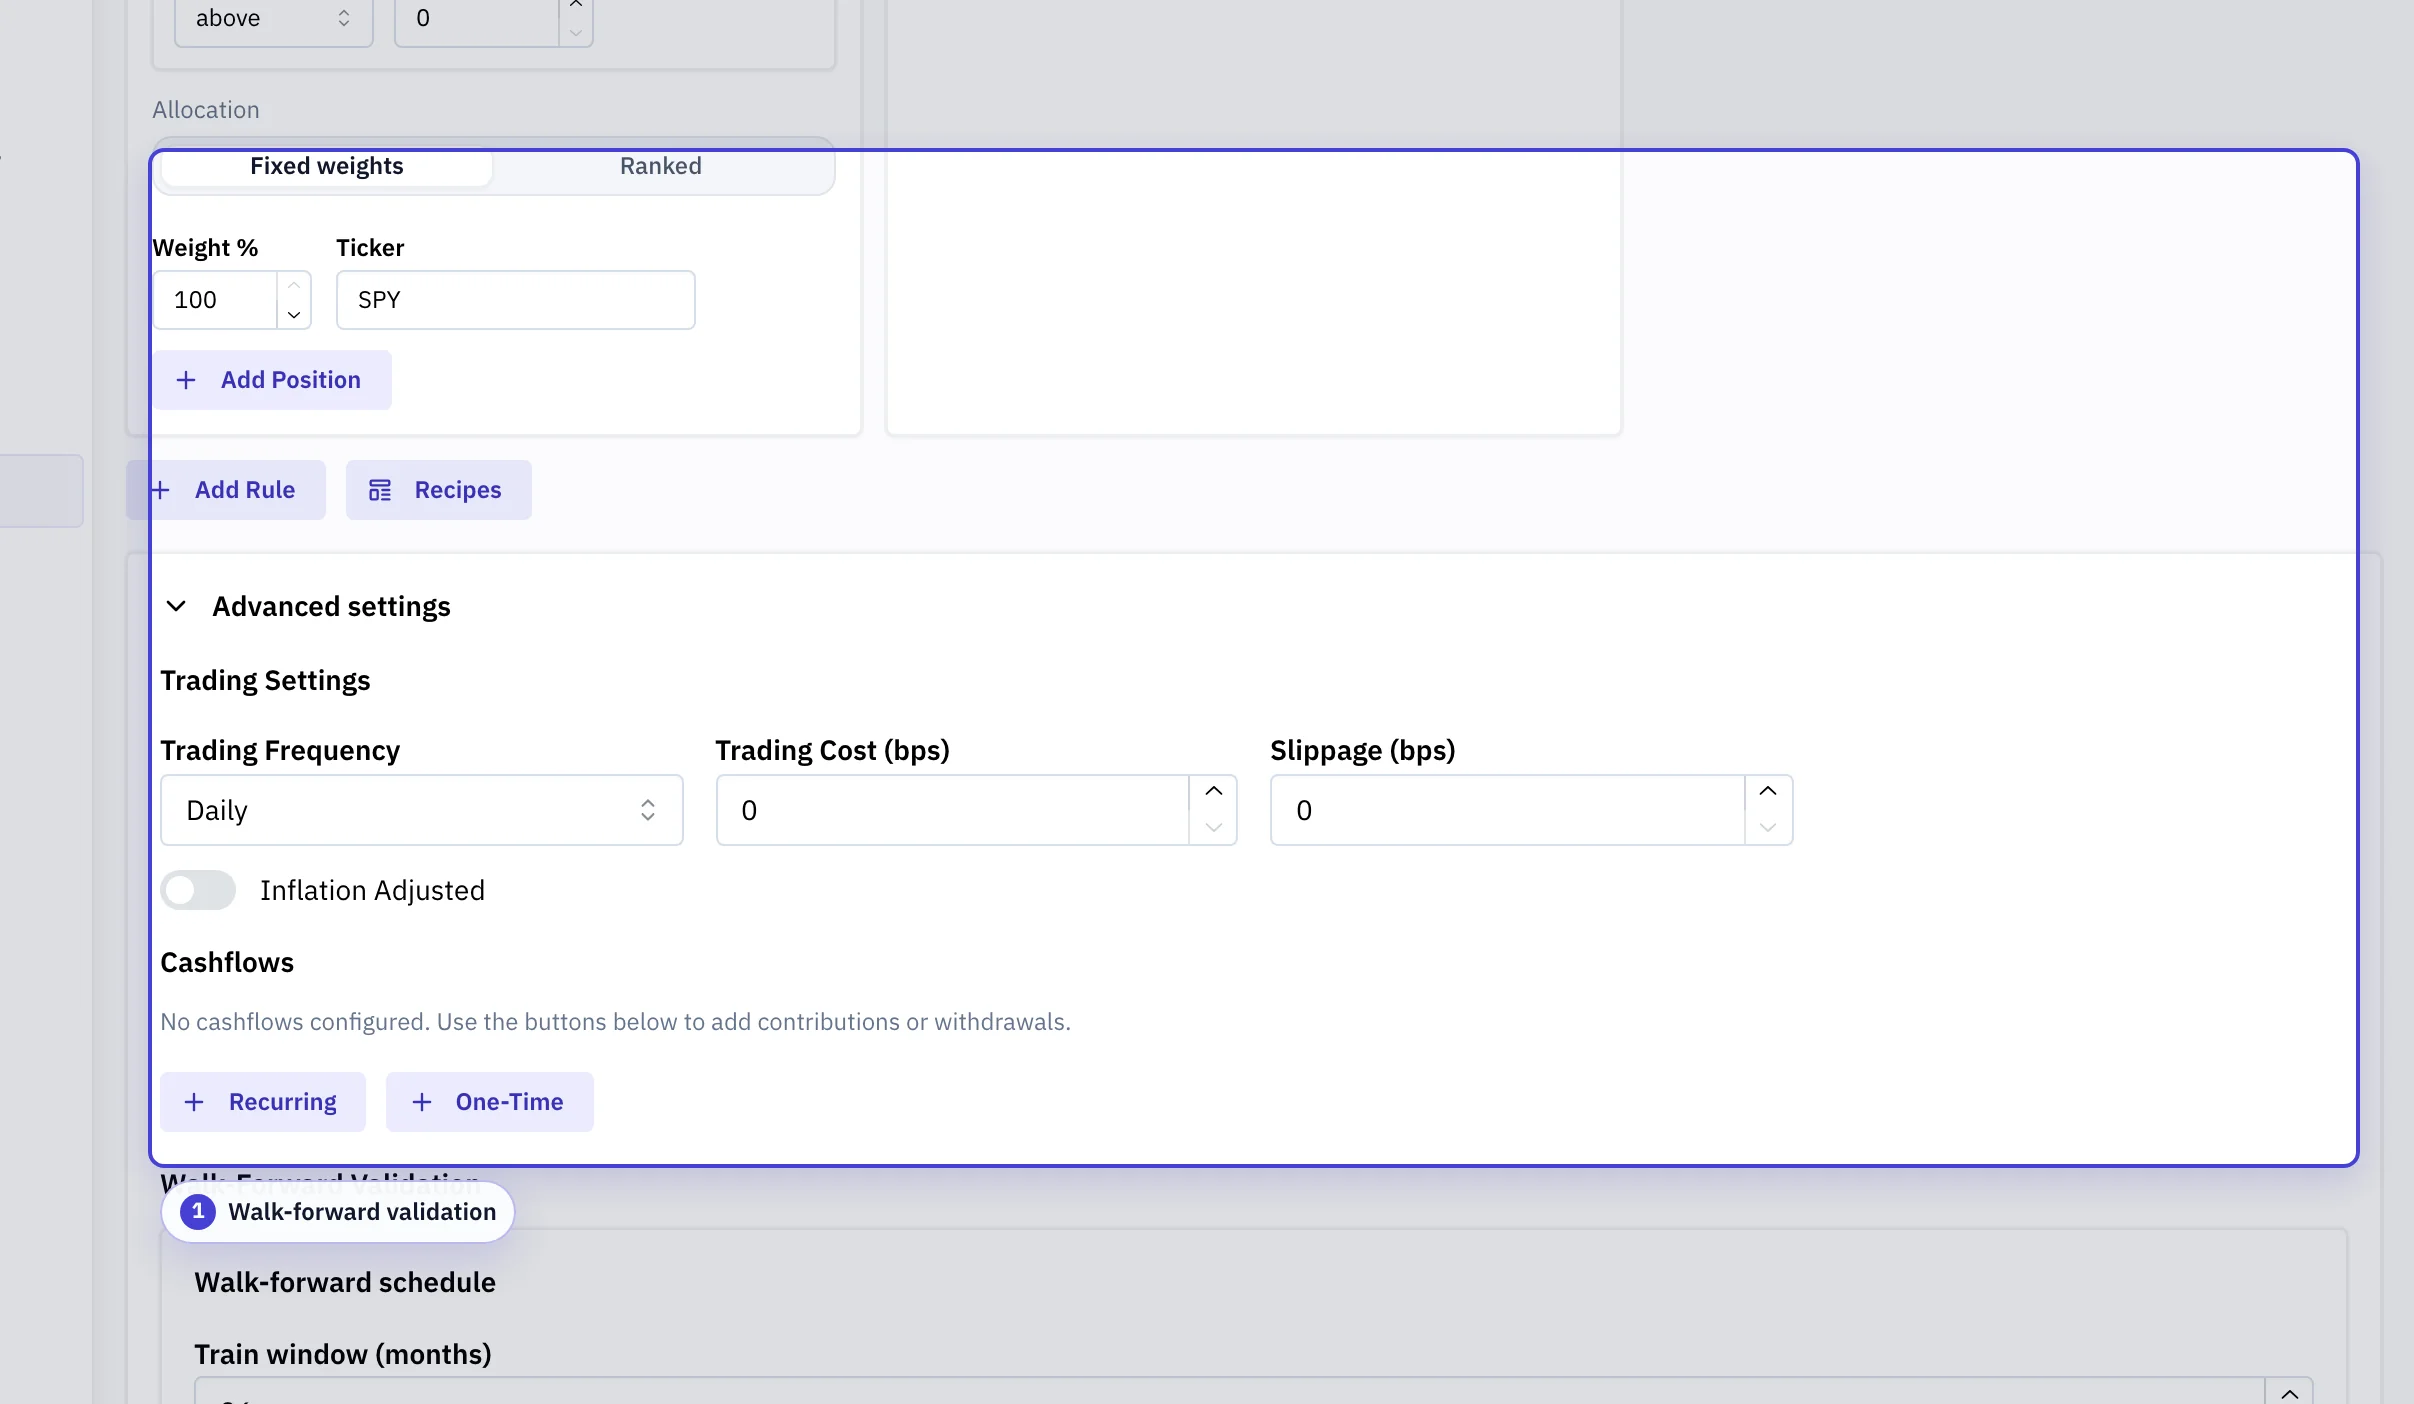
Make execution explicit
The defaults are reasonable, but a high-frequency strategy needs costs set realistically.
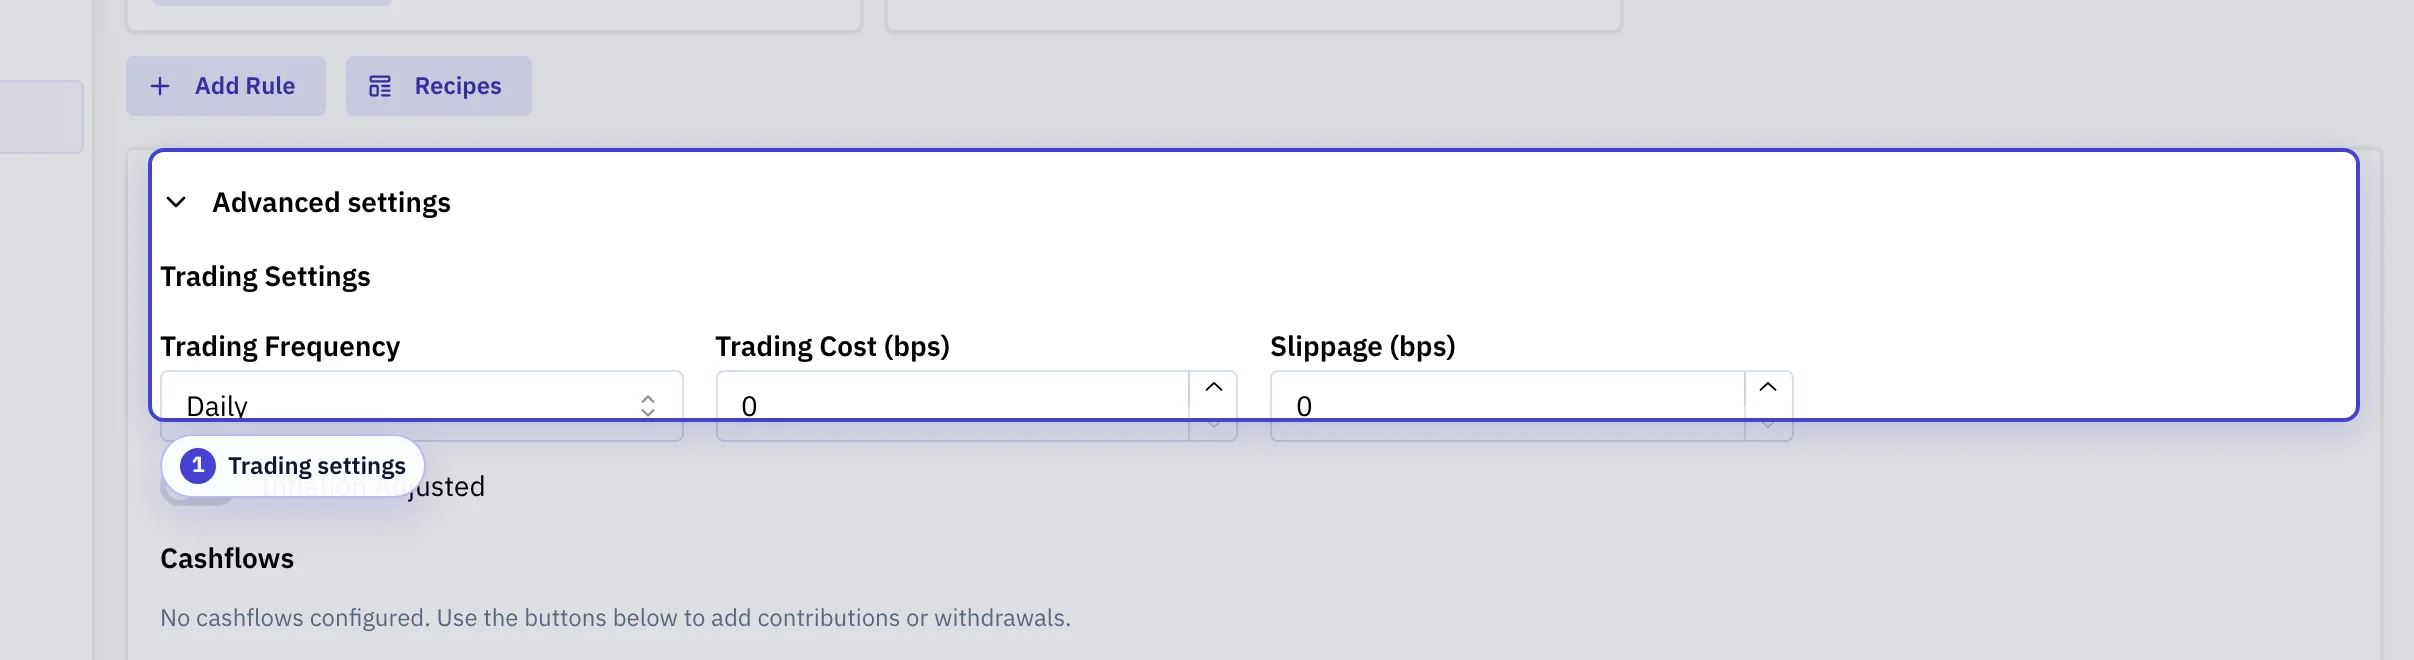
Trading settings: Evaluation frequency, per-trade cost, slippage, and the inflation lens applied to charts.
Validate parameters out-of-sample
Walk-forward retrains on rolling train windows and evaluates on the next test window.
Walk-forward validation: Rolling train and test window lengths, the step between iterations, and how windows with too little data are handled.
| Configuration | What It Means | Why It Matters |
|---|---|---|
| Scenario | Date range, benchmark, principal, and shared execution assumptions for the strategy run. | These settings define the historical test bed used to judge every rule transition. |
| Rule order | Rules are evaluated from top to bottom; the first active rule wins. | Ordering is part of the strategy logic. A broad rule above a specific rule can prevent the specific rule from ever firing. |
| Fallback rule | The allocation used when no earlier signal is active. | Without a fallback, the strategy can have undefined behavior during regimes that do not match the signal set. |
| Signal definition | The condition that turns a rule on, such as trend, momentum, volatility, macro, calendar, or composite logic. | Signal design determines when trades happen. Small threshold or lookback changes can materially alter state history. |
| Trading frequency | How often the strategy can evaluate and switch rules. | Higher frequency reacts faster but can increase whipsaw, turnover, taxes, and slippage. |
| Lag and cooldown | Controls that delay execution or prevent rapid repeat switching. | These settings make the test more implementable, but they also change the timing of every transition. |
| Ranked allocation | A dynamic rule that selects assets from a universe by a ranking metric. | Ranking adds another model layer: universe, metric, lookback, selection count, and fallback all affect holdings. |
Common pitfalls
Forgetting a fallback rule
Without a fallback, the strategy has undefined behavior in regimes none of your conditions describe. Always end the rule list with a fallback.
A broad rule above a specific rule
Rules evaluate top to bottom; the first match wins. Order from most specific to fallback, otherwise narrower rules never fire.
High trading frequency without realistic costs
A daily-evaluation strategy that turns over weekly looks great until you set transaction cost and slippage. Set both before drawing conclusions.
Tuning thresholds until in-sample looks good
Run the in-sample / out-of-sample holdout. If the OOS table is much worse, you've overfit the threshold to a single regime.
What you'll see in the result
- Equity curve: Strategy and benchmark value through time. Look at recoveries, not just endpoints.
- Rule timeline: Which rule was active each day. Frequent flipping suggests a noisy signal or a threshold near the boundary.
- Trading stats: Transition count, time in each rule, and aggregate trading cost. High cost can quietly erase a strategy's edge.
- Rule attribution: How much each rule contributed to total return. If one rule dominates, the others may not be earning their place.
- Signal history: The numeric indicator value, threshold lines, and boolean state for each atomic signal. Match the chart to the rule timeline to verify decisions.
Video walkthrough
Walkthrough
Video walkthrough
Features
- Composite signals with AND/OR/NOT logic
- Regime-based allocation switching
- Ranked allocation rules that pick the top or bottom N tickers from a universe by a ranking metric
- Trading frequency and cooldown controls to reduce whipsaw
- Signal state timeline visualization
- In-sample / out-of-sample holdout split with per-slice metric tables
- Save and share tactical configurations
When To Use It
- Use Strategy Builder when you want to switch between different holdings based on a signal or rule set.
- Use Signal Analyzer first if you still need to test whether an indicator has a relationship with a later outcome.
- Use Portfolio Backtest when the portfolio does not change state based on signals.
Core Concepts
- Allocation rule: a named asset mix whose fixed and ranked sleeves sum to 100%.
- Signal: a boolean condition that determines whether a rule is active.
- Rule order: rules are checked from top to bottom. The first rule whose signal is true becomes active.
- Fallback rule: the last rule should have no condition. It is used when no earlier rule is active.
- Trading frequency: how often the engine can switch between rules.
- Signal return basis: whether tactical signals use total-return series or price-only raw closes. Total return is the default. Uploaded
U.*aliases and unsupported.SIMraw signal series usetotal_returnwith a warning; execution price paths still use the selected mode. - Execution lag: rule changes trade no earlier than the next trading day. Same-day execution is not modeled in Strategy Builder backtests.
- Ranked rule: an allocation rule that, instead of fixed weights, picks the top or bottom N tickers from a universe by a ranking metric every rerank row.
Ranked Allocation
Any rule can pick tickers dynamically instead of using fixed weights. Change the rule's allocation type to ranked and configure the universe, the ranking metric, the lookback, and how selected tickers are weighted. On every rerank row the engine scores the universe, drops any ticker that fails optional score thresholds or has insufficient price history, takes the top or bottom N, and forward-fills the selection until the next rerank.
- Universe: 2 to 29 plain tickers to rank. The fallback is separate, so the total pool is up to 30.
- Metric: total return, volatility, price-over-SMA ratio, or RSI. The same metric applies to every ticker in the universe.
- Lookback: primary window in trading rows, with up to three optional secondary lookbacks. Scores are averaged across lookbacks, or combined with per-lookback weights when specified (for example the 12/4/2/1 weighting used by VAA, BAA, and HAA strategies).
- Select and N: hold the top or bottom N tickers after sorting by score.
- Weighting: equal weight across the selected tickers, or inverse-volatility weighting proportional to 1 / annualized volatility over the primary lookback.
- Score thresholds: optional min and max scores that exclude tickers before selection. Useful for absolute-momentum filters that fall to cash when nothing passes.
- Fallback ticker: held for the ranked sleeve whenever zero tickers survive filtering.
- Rerank cadence: follows the strategy's trading frequency (monthly reranks every 21 trading rows, quarterly every 63, etc.). Between reranks the selection is forward-filled.
- Ranked sleeve %: percent of the rule assigned to the ranked sleeve, in the range 1 to 100. Use 100 to keep the rule ranked-only. When set below 100, the remainder fills a fixed sleeve defined by the rule's static weights.
Composing a fixed sleeve with the ranked sleeve. When Ranked sleeve % is below 100, the rule's weights field is reused as the fixed sleeve. The composition rule is: realized = (ranked top-N picks × sleeve_fraction) + (fixed sleeve at its weights), where sleeve_fraction is Ranked sleeve % divided by 100. Aggregation is additive when tickers overlap, but the schema rejects fixed sleeve tickers that also appear in the universe or equal the replacement ticker, so the only place ranked and fixed contributions can stack is on the fallback ticker. Fixed sleeve tickers count as calendar anchors. A fixed sleeve ticker that has no executable price on a rebalance date forces the entire rule to fall back to the default rule for that day, and a late-inception ETF added as a fixed sleeve shortens the effective backtest start to that ticker's inception. Missing universe tickers, in contrast, are simply skipped during ranking.
Example. A rule with Ranked sleeve % = 70, universe = [SPY, QQQ, EFA], fallback = BIL, n = 2, and fixed sleeve = [{AGG, 30%}] holds 35% of each of the top-2 ranked picks plus 30% AGG on every rebalance.
Ranked rotations count as rebalance events, so trading-cost and slippage haircuts apply on the decision row the same way they do for fixed-weight rule transitions. What-if price overrides cannot target ranked universe or fallback tickers.
Build A First Rule Set
- Add a Risk-On rule with the assets you want to hold when the signal is true.
- Add a fallback rule with the assets you want to hold when the signal is false.
- Choose one signal, such as price above or below a moving average.
- Set the date range, principal, benchmark, and trading frequency.
- Run the analysis and review the equity curve, transition count, drawdowns, and rule timeline.
A good first build is one risk-on rule, one fallback rule, and one signal. Add more conditions only when the research question requires them.
Main Inputs
- Date range: historical sample used in the run.
- Principal: starting portfolio value.
- Benchmark: reference series used for comparison.
- Trading frequency: daily, weekly, biweekly, monthly, quarterly, or annual switching cadence.
- Trading costs and slippage: implementation costs applied to rule transitions.
- Cashflows: recurring or one-time contributions and withdrawals.
- In-sample / out-of-sample holdout: optional split date used to show separate metric tables for the in-sample window and the later out-of-sample window of the same realized strategy run.
Signal Types
Strategy Builder supports atomic signals and composite operators:
- Trend: moving average and related price-based rules, including dual-moving-average hysteresis
- Momentum: return momentum, composite momentum, and relative strength
- Volatility and risk: VIX, volatility, RSI, drawdown, and correlation rules
- Macro and calendar: yield curve and date-based filters
- Composites: AND, OR, and NOT over other signals
Results Panels
- Equity Curve: portfolio and benchmark value through time.
- Trading Stats: transition count, time in each rule, and trading costs.
- Metrics: return and risk summary statistics.
- Monthly Returns Heatmap: monthly and annual return breakdowns.
- Rule Attribution: return contribution by rule.
- Condition Stability: signal and rule behavior through time.
- Signal History: historical time-series of each atomic signal's numeric indicator value and boolean state. Threshold lines and transition markers show how signal evaluations align with rule changes. Uses the same evaluation path as the backtest, so charted values match the decisions the engine made.
- Ranking: appears when any rule uses ranked allocation. Shows the latest selection and per-ticker scores, when the fallback ticker fired, and the realized rerank history.
- Current Status: latest fully-observed rule, signal state, and active weights. Use this to confirm the strategy is doing what you expect on the latest data.
- In-Sample / Out-Of-Sample: paired metric tables for the in-sample window and the later out-of-sample window when a holdout split is enabled.
For a step-by-step debugging workflow, see Debug A Tactical Strategy below.
In-Sample / Out-Of-Sample Holdout
Strategy Builder supports an in-sample / out-of-sample holdout overlay. Choose a split date to compare the strategy's metric table before and after that date on the same realized backtest path.
- The split does not refit signal thresholds or change rule order, ranked selections, transition timing, costs, or cashflows.
- The requested date snaps to the nearest trading day on or before the selected date. Both sides need enough trading history; otherwise the result shows a warning instead of partial metrics.
- For rolling or expanding train/test schedules, use Walk-Forward Validation in the Strategy Builder configuration section.
Debug A Tactical Strategy
When a tactical strategy produces unexpected results, work through these steps:
- Open the Strategy Builder with the strategy loaded.
- Check the Condition Stability panel. Frequent switching may indicate a noisy signal or a threshold set too close to the boundary.
- Check the Rule Attribution panel. If one rule contributes most of the return, the other rules may not be firing at useful times.
- Check the Trading Stats panel. High transition counts combined with trading costs may erode performance.
- Open Signal Analyzer and test the signal in isolation to see whether it has forward predictive value for the target asset.
Signal Research To Strategy
The typical signal-to-strategy workflow moves through three tools:
- Signal Analyzer: test whether an indicator predicts a later outcome. Evaluate hit rate, return spread, and forward-return distributions by signal regime.
- Strategy Builder: if the signal shows predictive value, build a tactical strategy that switches allocations based on that signal. Review transition behavior and rule attribution.
- Portfolio Backtest: load the tactical strategy into a portfolio allocation and run a full historical backtest with cash flows, rebalancing, and optional tax-aware accounting.
See Signal Analyzer and Portfolio Backtest for the individual tool references.
Glossary
Glossary
- Allocation rule
- A named asset mix whose weights sum to 100%, evaluated against a condition.
- Signal
- A boolean condition (trend, momentum, volatility, calendar, etc.) that turns a rule on or off.
- Fallback rule
- A rule with no condition, placed last. The strategy holds it whenever every earlier rule's signal is false.
- First-match-wins
- Rules evaluate top-to-bottom; the first rule whose condition is true determines the active allocation.
- Whipsaw
- Rapid switching between rules driven by a noisy signal. Often costs more than the signal earns.
- Cooldown / lag
- Controls that delay execution or block repeat switches. Make backtests more implementable but change every transition's timing.
- Ranked rule
- An allocation that picks the top or bottom N tickers from a universe by a metric, instead of holding fixed weights.
- Fixed sleeve
- The portion of a ranked rule allocated to specific tickers at fixed weights, distinct from the ranked sleeve which holds top-N picks. The fixed sleeve is defined by the rule's weights field and fills 100 minus Ranked sleeve %.
- Walk-forward validation
- Refit on a rolling train window, evaluate on the next test window. Surfaces whether parameter choices generalize.